Exporting interactive figures
ORIGAMI enables creation of HTML/JavaScript webpages which embed interactive versions of figures visualised in ORIGAMI. Practically all figures that you can generate in the desktop application can be also exported to a HTML document that can be shared with your supervisor, journal reviewers or collaborators for their in-depth interrogation.
While this might seem like a bit of a gimmick, it makes sense to share the results with the scientific community in a manner more explorative than a simple static image. See here for some helpful encouragement (Perkel and Weissgerber).
Example
In this example we will use a file provided with the ORIGAMI distribution. You can download MS file or you can find it in your ORIGAMI directory (example_data/text).
Interactive output panel
You can use any example file here as once you open the output window, all available plots will be shown in a list. In this case, the list contains all available items from a number of previous examples (e.g. annotating mass spectra, combining drift voltages, etc).
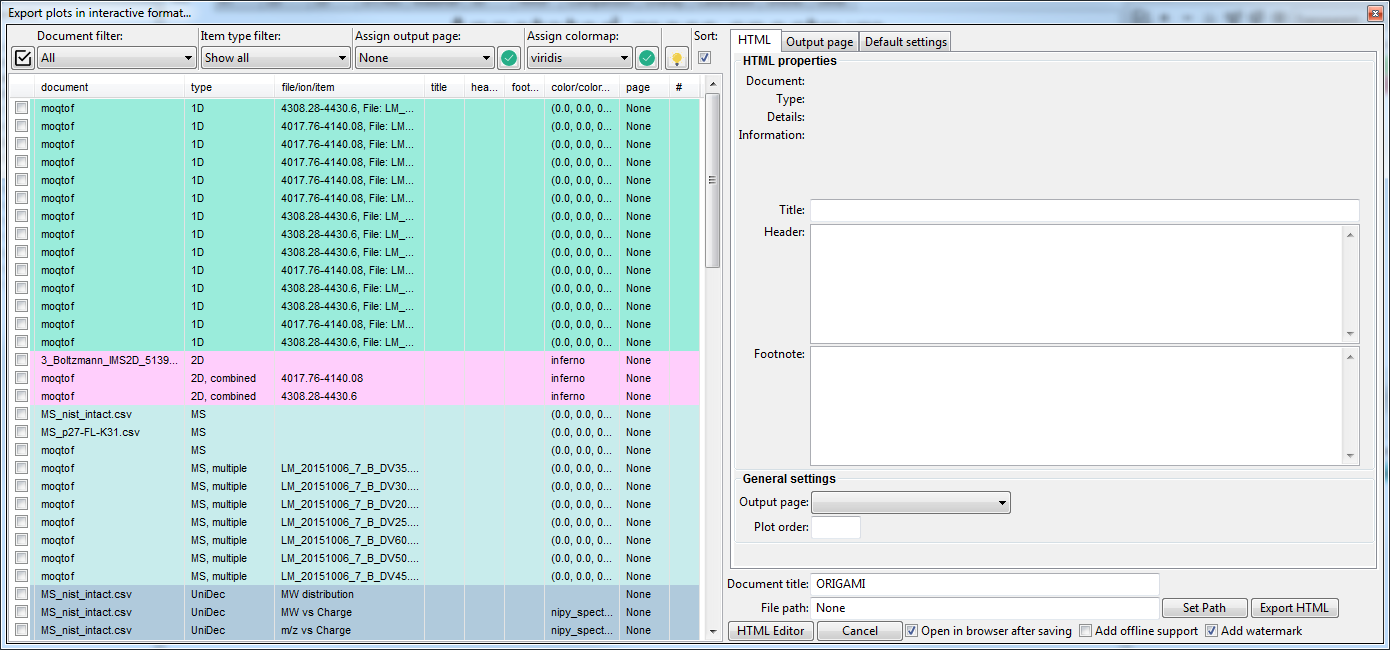
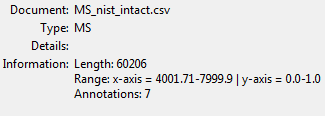
If you click on any item in the list, its previously provided settings such as title, header, footnote information or plot parameters will be automatically rendered. Focusing on a mass spectrum first, you can see some useful information about the size of number of annotations, min/max ranges and its size.
Check that item and click on the Export HTML button. You will be asked to provide a path where you would like to save the document. Make sure to check the Open in browser after saving checkbox.
You can checkout a mass spectrum example here and heatmap example here.