UniDec deconvolution
UniDec is a Bayesian deconvolution algorithm that can be used to deconvolute mass spectra and ion mobility-mass spectra. It was developed by Dr. Michael Marty and is freely available under the modified BSD licence. I would highly recommend you check-out UniDec (and MetaUniDec) software.
If you use it in your work, please cite their work:
Video tutorial
Deconvolution in ORIGAMI-ANALYSE
Any mass spectrum within a ORIGAMI document can be deconvoluted and therefore a document can contain tens of spectra, each with its own deconvolution results. The easiest way to get started is to find an item in the Document Tree, right-click on it and select Deconvolute using UniDec... which will open a new panel where you can adjust the parameters.
Example data
In this example we will use a file provided with the ORIGAMI distribution. You can download MS file or you can find it in your ORIGAMI directory (example_data/text). This file contains a mass spectrum of a intrinsically disordered protein, p27 that is approx. 22.5 kDa in size and has a very broad charge state distribution.
Loading data
Please have a look at Loading Text files. In short, you either drag-and-drop the text file in the main window of ORIGAMI-ANALYSE or go to File -> Open MS Text file.
Deconvolution
Once you've loaded data, right-click on it in the Document Tree and select Deconvolute using UniDec... If you are using the example file, you can start with the settings shown below:
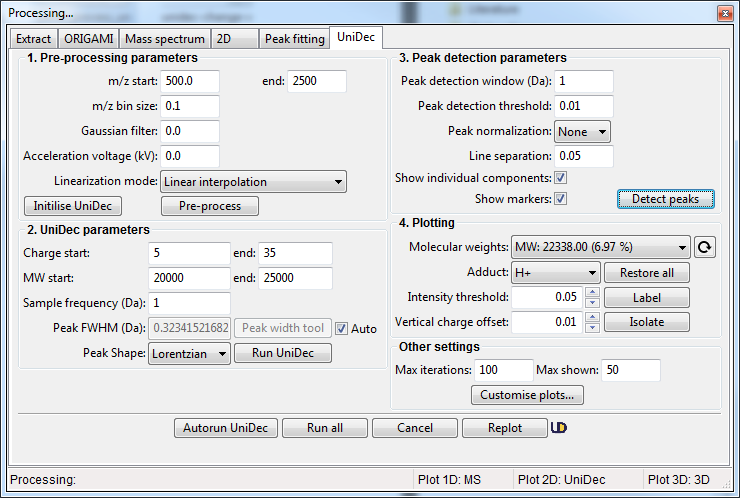
- Specify Pre-processing parameters. You can start with m/z start = 500 and m/z end = 2500 with m/z bin size = 0.1 using Linear interpolation method. Click on the Pre-process button. If you are using the Tabbed view, the results will be shown in the tab UniDec -> MS
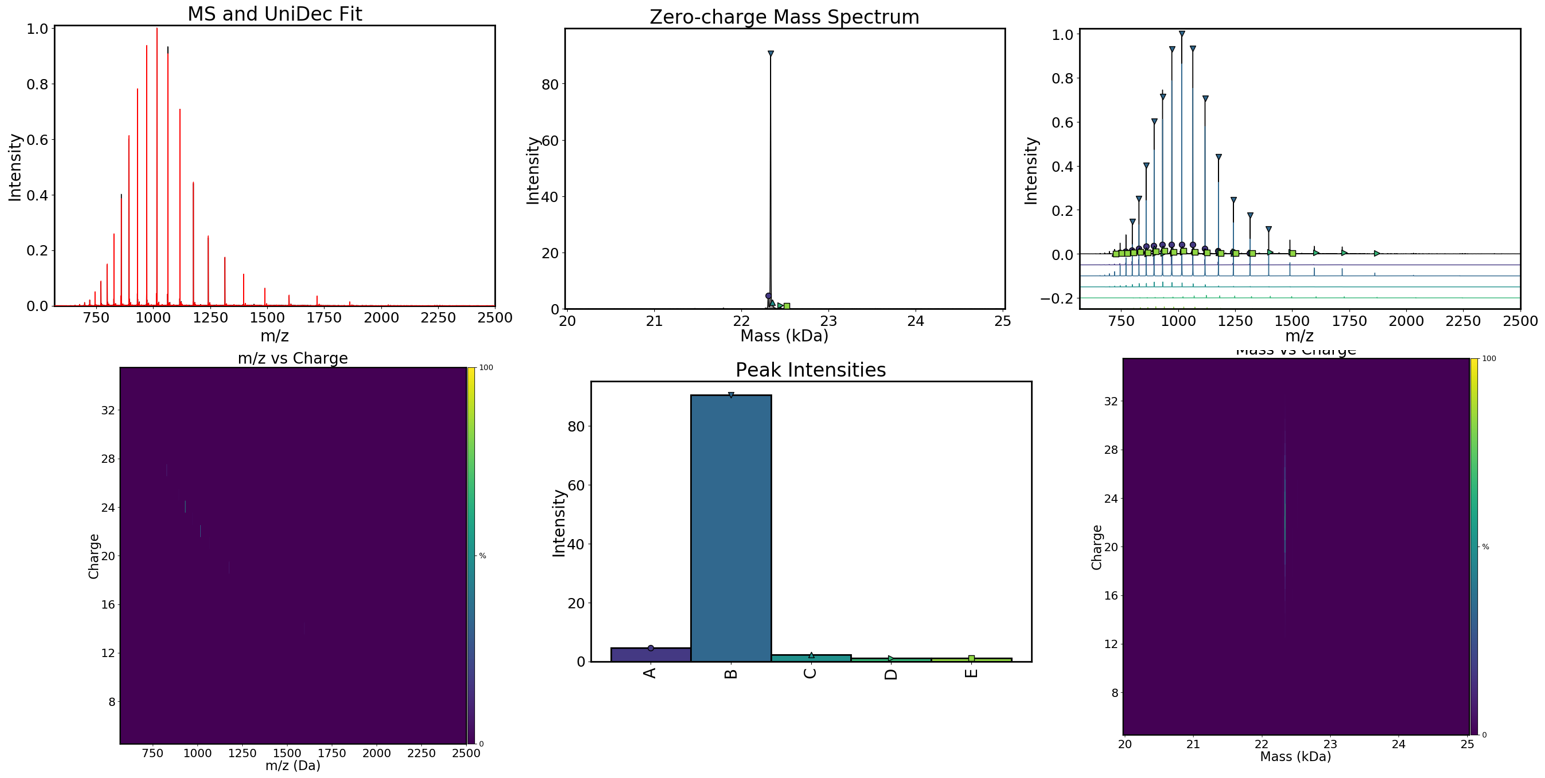
- Specify deconvolution parameters. If you are unsure about the sample you are analysing, specify a broad range of charge states and the molecular weight with large-ish Sampling frequency. This will help you narrow down the appropriate range for your sample. Once you are happy, click on the Run UniDec button. If you are using the Tabbed view, the results will be shown in UniDec -> m/z vs Charge / MW vs Charge / MW tabs.
- Following successful deconvolution, you can find peaks and identify the found molecular weights. To do this, specify appropriate parameters in the Peak detection parameters section and then click on the Detect peaks button. If you are using the Tabbed view, the results will be shown in UniDec -> Isolated MS / Barplot tabs.
Visualisation of results
Visualisation of individual species
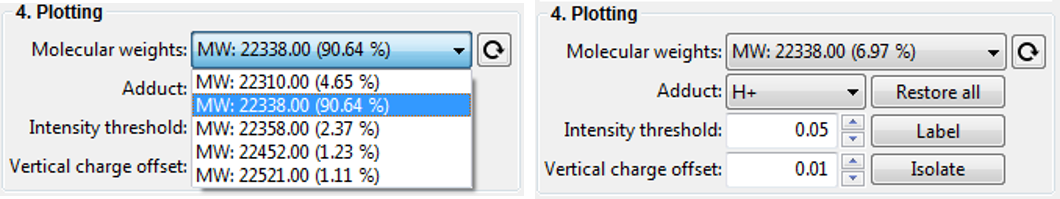
If you are lucky, deconvolution will result in a single species being detect. This is rather unlikely and therefore you will be presented with a range of detected MW. In order to select and visualise only one species at at time, you can select an item with a molecular weight in the Dropdown menu (see below) and click on the Isolate button. You can also label its charge states by clicking on the Label button.
Note: It is likely that the automatic label optimiser is enabled and you can change that by clicking on the Customise plots... button and unchecking the Optimise label position option.
Saving plots
The easiest way to save any plot in ORIGAMI-ANALYSE is to plot it, customise it and then right-click in the plot area and select Save figure....
Note: It is likely that the figure will be automatically resized to a pre-defined image size. This can very occasionally cause problems, therefore you disable that option by unchecking the Resize on saving menu item.
Saving data
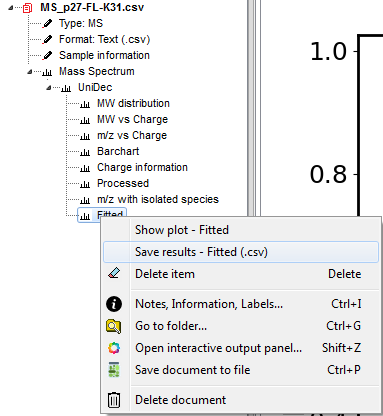
All deconvolution data is saved within the document and if you to the Document Tree and open-up the item (see below), you can right-click on any item and select the option Save results. If you click on the UniDec header, you can save all results at the same time.
Plotting and replotting
Find the desired item in the Document Tree and double-click on it to plot it.