What changed in ORIGAMIANALYSE
Documentation
 Added online documentation
Added several new videos to the YouTube playlist
Document Tree
 Fixed typo: spectrun -> spectrum (grr)
When loading mzml/mgf files, the individual scans will no longer be shown in the document tree as it caused some major issues. If you would like to see the individual spectra, please double-click on the header 'Tandem Mass Spectra'
Fixed a problem when trying to plot waterfall plot from the Document Tree menu
 When loading any data into the INTERACTIVE document, you will be asked whether data should be duplicated, merged or duplicated
When plotting a waterfall plot, data will be checked to ensure its not too big (e.g. not too many rows). If the value is above the threshold (set to 500), you will be asked if you would like to continue
Main window
Added new menu: Plugins. This menu will hold all future mini-applications
Umder the menu Plot settings I've added a couple new options that allow modification of plot extra plot parameters.
The help pages (Help -> Help pages -> ...) have now been replaced with links to the new documentation (opens in the browser). Where no documentation exists yet, old pages will be shown. Also available online
Annotations
you can now also easily 'duplicate/multiply' annotations. Action -> Multiply annotations... this will result in a copy of the selected annotation(s) with slight difference in the min-value (so they can be distinguished from its parent)
Text annotations can now be added to other plots (scatter, v-bar, h-bar, waterfall, multi-line/overlay). To added annotations, find it in the Document Tree, right-click on it and you should be presented with option Show annotations panel.... Then you can simply follow the standard annotations protocol. See here for more information
Annotations parameters can now be easily modified as they can be dragged on the plot. If an annotation is shown on your plot, you can simply drag it around in the plot area and once you let-go, new settings (e.g. position) will be updated in the ORIGAMI document.
font size, weight and rotation will now be aplied when adding labels
auto-label generator will now also create labels based purely on the charge state
annotation parameters (e.g. size, weight, rotation) will be respected when replotting from the Document Tree
Interactive panel
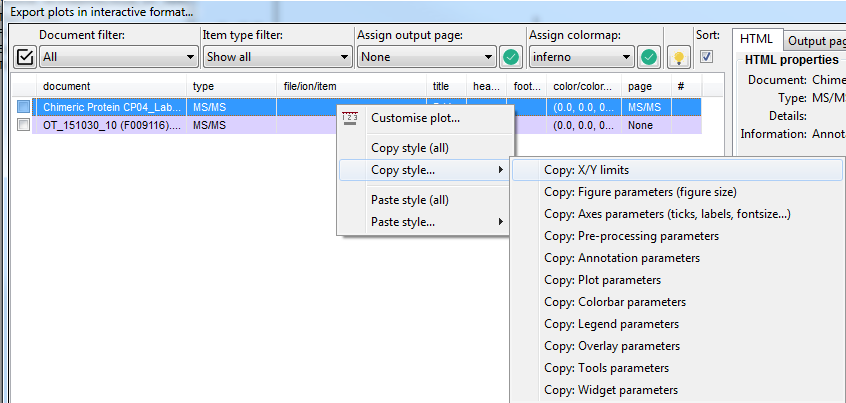
Made big progres in terms of copying/applying styles for plot elements. When you
double-click on any element in the file list a new window will appear where you can individually adjust plot parameters. When you finished, you can right-click on that same (or any other) item in the list and select 'Copy style..'. You can then select any other item in the list, right-click on it and select 'Apply style..'.
certain plot types (v-bar, h-bar, scatter, waterfall, multi-line/overlay) will now support addition of annotations (and their widgets). Annotations can correspond to anything you wish to say about specific region of a dataset.
Scatter plots that are created from datasets loaded through text files with added metadata can be enhanced with weblinks/URLs. See the example for more information.
fixed sorting in the list (especilaly when using the 'Show selected' option) Lists are sorted using 'natural sorting' from now on, meaning they should be more logically sorted.
fixed the show/hide table elements when you right-click on the table headers
Colorbars:
- added loads of new settings users can control
- better behaviour when adding colorbars to plots
 removed tools/toolset from ORIGAMI - the new system of copy/apply style should work much better
I've realised that using 'coffeescript' for widget exportation was a big mistake as it takes ~10x+ longer to compile that script than pure JavaScript. Adding widgets will be a lot faster from now on (a couple haven't been ported to JS yet).
Plots
Improved color handling in violin and waterfall plots. The line color (edge) and shade/fill-under can be independently controlled now.
UVPD processing  
Added new plug that allows analysis and processing of UVPD datasets that were acquired with laser being constantly switched on/off. This is a user-specific plugin that will most likely have no use for anyone else apart from some Barran group members. To activate, click on the Menu -> Plugins -> UVPD processing window....
Tandem MS panel
You can now load .mzML files (haven't figured out how to add .mzIdentML files to them yet...)
MS/MS files can now be exported in an interactive format (.html document). This feature is still in development and I imagine will not be stable until v1.2.2 at the earliest. At the moment, individual scans of MS/MS file (.mgf only) can be annotated (e.g. fragments can be generated) and added to the file. Scans that have been user-annotated can be subsequently exported. This will be properly showcased in a tutorial.
Added two new options in the Action menu which permit improved population of the table by either excluding scans with PTMs and excluding scans without identification. Clicking on either of these will automatically trigger re-population of the table based on the selected options.
You can see what PTMs have been included in the scan by clicking on the Modifications list
Scans that have multiple identification information will be separated into separae instances in the table (e.g. look at the column ID #)
Fragment generator can now handle PTMs (at least those that have kept the mass information)
Improved the way scans are loaded (faster and actually works...)
Improved the way butterfly plots are shown. A horizontal line will be drawn from now on (at y=0)
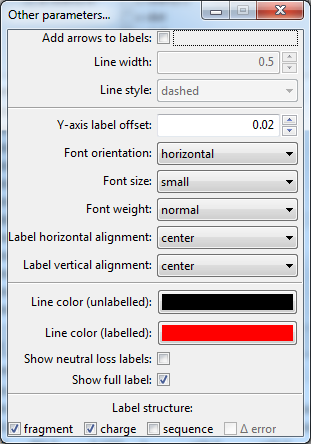
Added several new customisation parameters that permit better data visualisation. These are found under Action -> Customise...
When selecting frag-all option, appropriate checkboxes will be ticked from now on
Fixed fragment generator to stop overriding fragments with same name (e.g. y1+ was equal y_H2Ox11+...)
Other data -> Annotated data
Added new keyword 'axis_url'/'axis_urls' to the data parser. These keywords can be used to provide web addresses which can be attached to the data (scatter points only for now). If valid URL address is provided, when you tap on a point you will be taken to a new tab in your browser which corresponds to the web address. This is only valid in the interactive plots
Changed the poorly selected name of 'Other data' to 'Annotated data'
Figures
Updated MS/MS panel
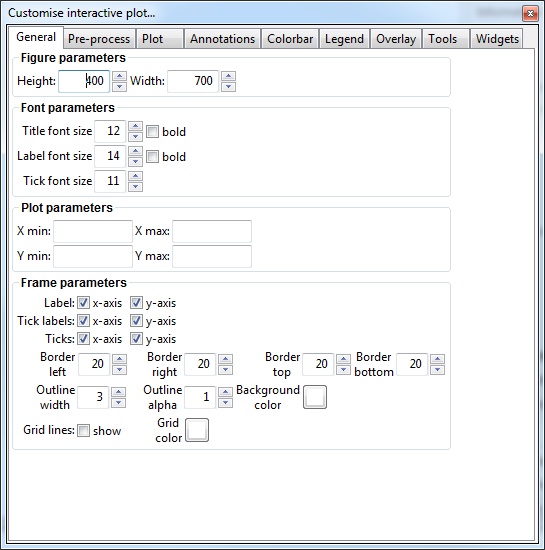
MS/MS customisation window
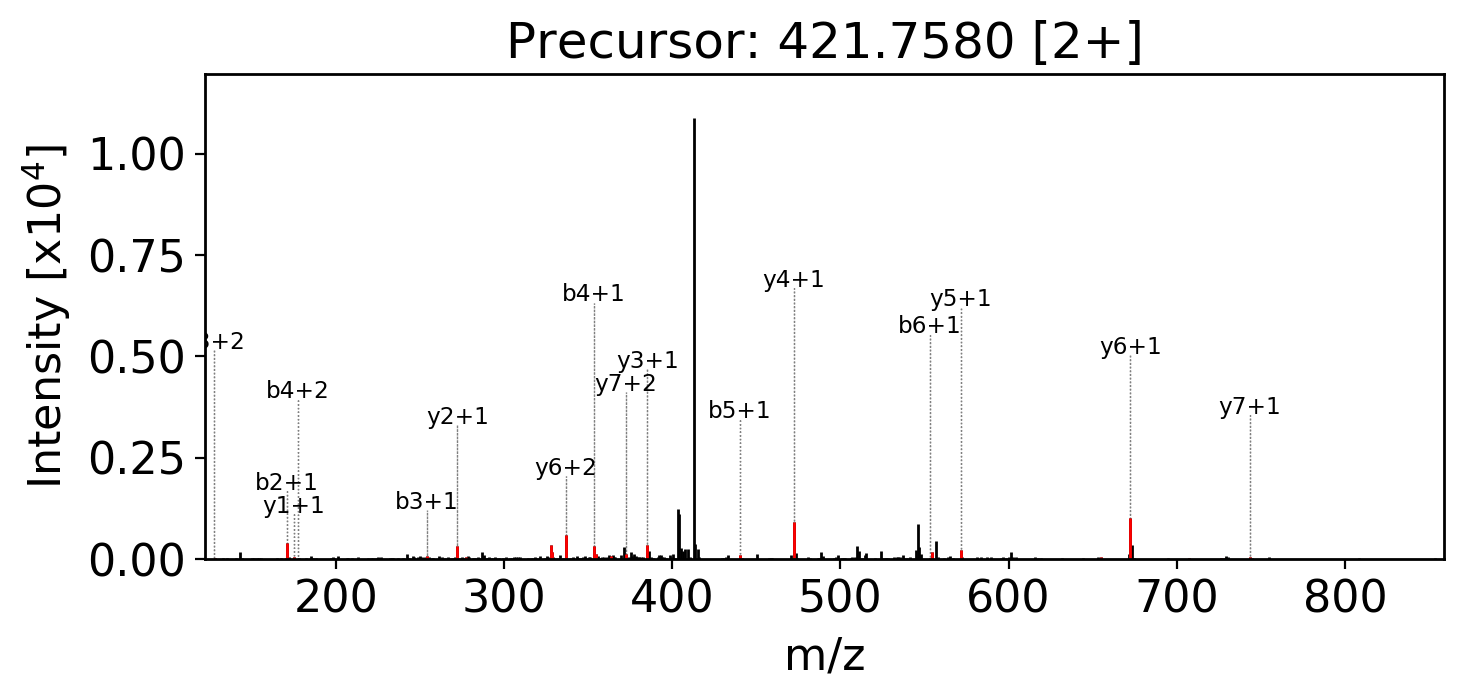
Annotated MS/MS mass spectrum with automatically generated arrows
Interactive data customisation window
Interactive copy style
Animation
Interactive adjustment of labels